
Every ticker, charted and measured.
One day to five years. Hold to read a point; two fingers measure a move.
MarketGrep · 市场把脉
Dollar liquidity, market breadth, risk, crowd sentiment, 13F filings and valuation, in one calm read on iPhone, iPad and Android.
Scan to installPoint your phone's camera here to get the right download for it.
New app
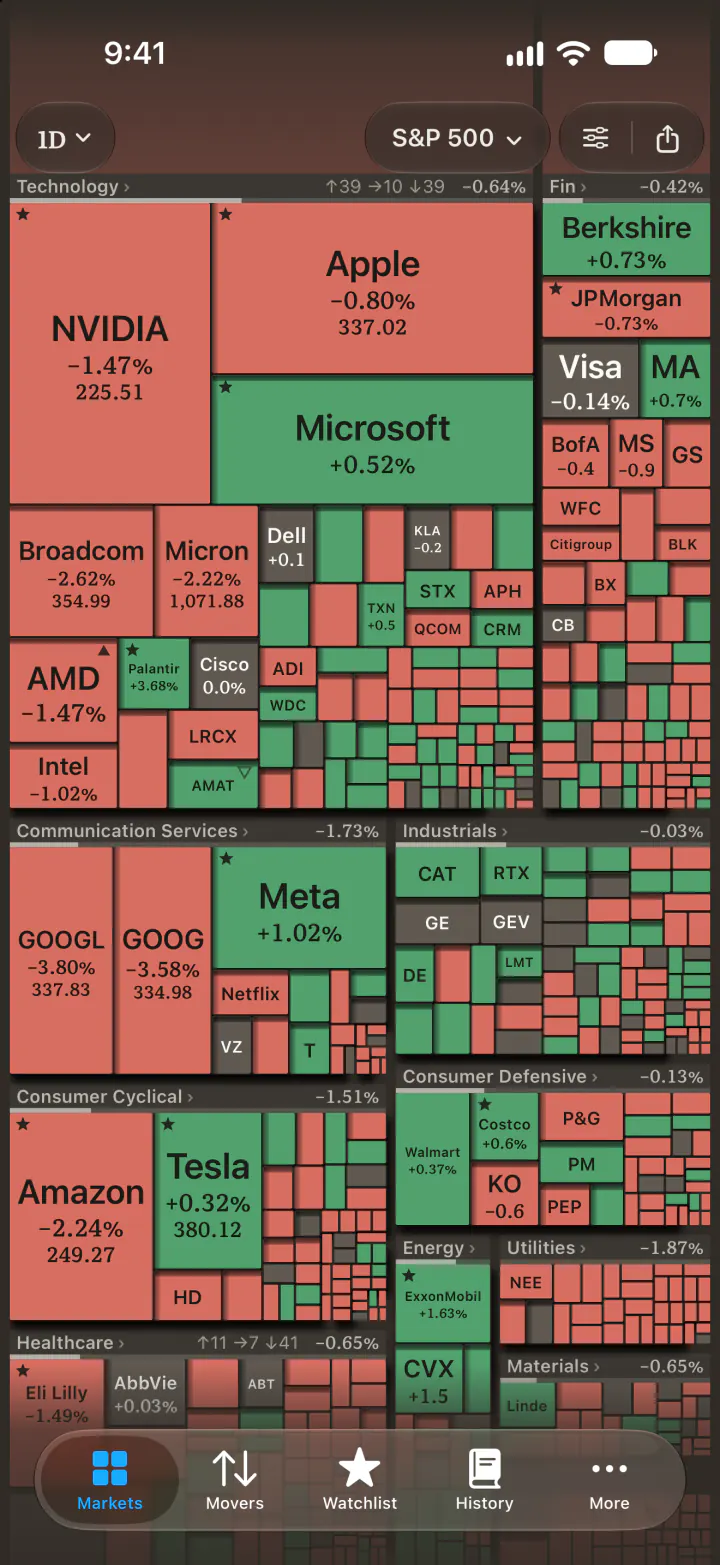
History of Market: Heat MapEvery S&P 500 company as a tile, sized by market cap, colored by its move and grouped by sector. Open a sector to see its industries, follow markets from Hong Kong to London, and keep the map on your home screen as a widget. Free to download for iPhone, iPad, Mac and Android.
Liquidity
One composite of US dollar liquidity, placed in its five-year range, with the drivers that moved it.
Sentiment
A 0 to 100 mood score and a full WallStreetBets report, before the open and after the close.
13F filings
Each manager's whole book from the latest filing: what was added, what was cut, and how assets moved.
Risk
Turbulence across a basket of US factors, with both alert thresholds on the chart and a reference exposure for each regime.
One day to five years. Hold to read a point; two fingers measure a move.
S&P 500 members above trend, four risk gauges, every index.
US market temperature on the webForward P/E for the S&P 500, Nasdaq-100 and two sectors, against five years.
Sort by turnover, change or volume.
Today's most active stocks on the web1D to 1Y and the distance from the 52-week high, sortable by any column. US stocks, Hong Kong listings and crypto.
Liquidity, sentiment, the most traded list and your watchlist, without opening the app.
Pin three tickers for live quotes and big-move alerts.
Any ticker, risk regime or 13F manager as a typeset image, ready for WeChat, iMessage or X.
Global indexes and commodities beside the US tape.
Put the pages you read most in the bottom bar; the rest wait in More.
Both themes on every device. Nine languages on iPhone and iPad; all but Vietnamese on Android.
Free on iPhone, iPad and Android, or open the web version in any browser.

Scan with your iPhone camera.
Scan with your Android camera.
For phones without Google Play. The app tells you when a newer build is out.
Daily market readings in any browser, with nothing to install. Made for a computer screen.
Open the web versionlite.marketgrep.comIn English and Simplified Chinese
Tap the ⋯ menu in the top-right, then choose “Open in Browser” to reach the App Store or Google Play.